Visualizing Data Patterns with Micromaps

Visualizing Data Patterns with Micromaps

by Daniel B. Carr, Linda Williams Pickle

182 pages· 2010· ISBN 9781420075748
About
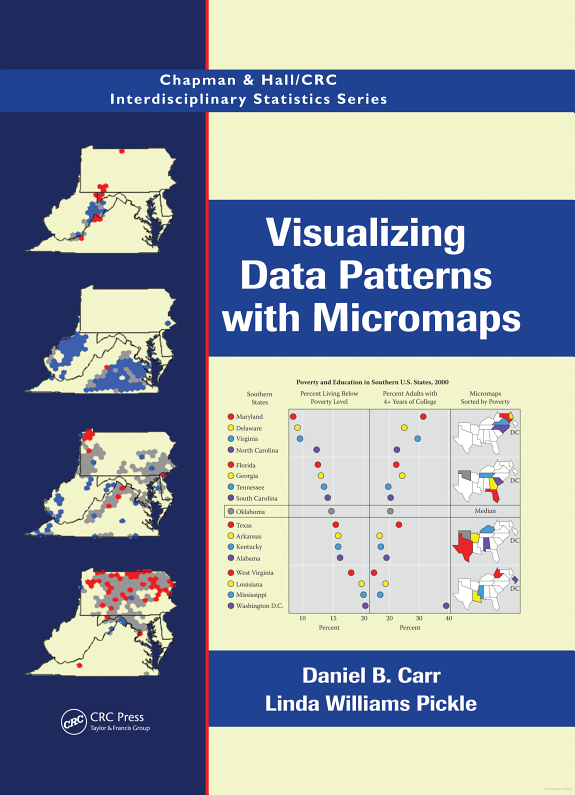
After more than 15 years of development drawing on research in cognitive psychology, statistical graphics, computer science, and cartography, micromap designs are becoming part of mainstream statistical visualizations. Bringing together the research of two leaders in this field, Visualizing Data Patterns with Micromaps presents the many design variations and applications of micromaps, which link statistical information to an organized set of small maps. This full-color book helps readers simultaneously explore the statistical and geographic patterns in their data. After illustrating the three main types of micromaps, the authors summarize the research behind the design of visualization tools that support exploration and communication of spatial data patterns. They then explain how these research findings can be applied to micromap designs in general and detail the specifics involved with linked, conditioned, and comparative micromap designs. To compare and contrast their purposes, limitations, and strengths, the final chapter applies all three of these techniques to the same demographic data for Louisiana before and after Hurricanes Katrina and Rita. Supplementary website Offering numerous ancillary features, the book’s website at http://mason.gmu.edu/~dcarr/Micromaps/ provides many boundary files and real data sets that address topics, such species biodiversity and alcoholism. One complete folder of data examples presents cancer statistics, risk factors, and demographic data. The site includes CCmaps, the dynamic implementation of conditioned micromaps written in Java, as well as a link to a generalized micromaps program. It also contains R functions and scripts for linked and comparative micromaps, enabling re-creation of all the corresponding examples in the book.

Discuss Visualizing Data Patterns with Micromaps with other readers

Join or start a book club for Visualizing Data Patterns with Micromaps on Readfeed. Live chat, shared reading progress, and AI discussion questions — free to get started.

Frequently asked questions

How do I join a book club for Visualizing Data Patterns with Micromaps?

Sign up free on Readfeed, then browse public clubs or start your own club with Visualizing Data Patterns with Micromaps as the current read. Invite friends with a share link and discuss together with live chat and AI discussion questions.

Can I discuss Visualizing Data Patterns with Micromaps with other readers online?

Yes. Readfeed book clubs let you chat live, share progress, and join discussions about Visualizing Data Patterns with Micromaps with readers worldwide — whether your club is virtual, in-person, or hybrid.

Is Readfeed free?

Yes. Creating an account and joining book clubs is free. Sign up to find readers who love the same books and start discussing today.