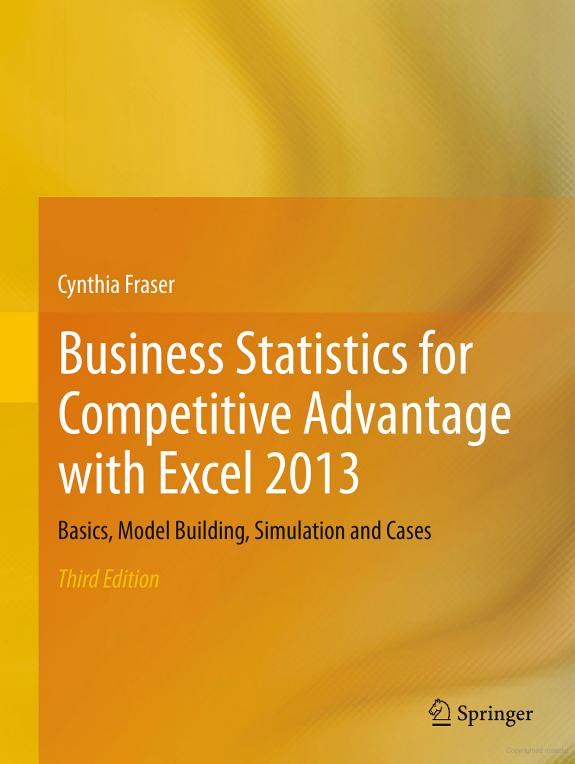
Business Statistics for Competitive Advantage with Excel 2013

Business Statistics for Competitive Advantage with Excel 2013

Basics, Model Building, Simulation and Cases

by Cynthia Fraser

449 pages· 2013· ISBN 9781461473817
About
Exceptional managers know that they can create competitive advantages by basing decisions on performance response under alternative scenarios. To create these advantages, managers need to understand how to use statistics to provide information on performance response under alternative scenarios. This updated edition of the popular text helps business students develop competitive advantages for use in their future careers as decision makers. Students learn to build models using logic and experience, produce statistics using Excel 2013 with shortcuts, and translate results into implications for decision makers. The author emphasizes communicating results effectively in plain English and with compelling graphics in the form of memos and PowerPoints. Statistics, from basics to sophisticated models, are illustrated with examples using real data such as students will encounter in their roles as managers. A number of examples focus on business in emerging global markets with particular emphasis on emerging markets in Latin America, China and India. Results are linked to implications for decision making with sensitivity analyses to illustrate how alternate scenarios can be compared. Chapters include screenshots to make it easy to conduct analyses in Excel 2013 with time-saving shortcuts expected in the business world. PivotTables and PivotCharts, used frequently in businesses, are introduced from the start. The Third Edition features Monte Carlo simulation in three chapters, as a tool to illustrate the range of possible outcomes from decision makers’ assumptions and underlying uncertainties. Model building with regression is presented as a process, adding levels of sophistication, with chapters on multicollinearity and remedies, forecasting and model validation, autocorrelation and remedies, indicator variables to represent segment differences, and seasonality, structural shifts or shocks in time series models. Special applications in market segmentation and portfolio analysis are offered, and an introduction to conjoint analysis is included. Nonlinear models are motivated with arguments of diminishing or increasing marginal response.

Discuss Business Statistics for Competitive Advantage with Excel 2013 with other readers

Join or start a book club for Business Statistics for Competitive Advantage with Excel 2013 on Readfeed. Live chat, shared reading progress, and AI discussion questions — free to get started.

Frequently asked questions

How do I join a book club for Business Statistics for Competitive Advantage with Excel 2013?

Sign up free on Readfeed, then browse public clubs or start your own club with Business Statistics for Competitive Advantage with Excel 2013 as the current read. Invite friends with a share link and discuss together with live chat and AI discussion questions.

Can I discuss Business Statistics for Competitive Advantage with Excel 2013 with other readers online?

Yes. Readfeed book clubs let you chat live, share progress, and join discussions about Business Statistics for Competitive Advantage with Excel 2013 with readers worldwide — whether your club is virtual, in-person, or hybrid.

Is Readfeed free?

Yes. Creating an account and joining book clubs is free. Sign up to find readers who love the same books and start discussing today.